Rainfall Records and Draw Rates in English League Fixtures: Analyzing the Connection
Written by Sofia Müller · Aug 20, 2026
Rainfall Records and Draw Rates in English League Fixtures: Analyzing the Connection
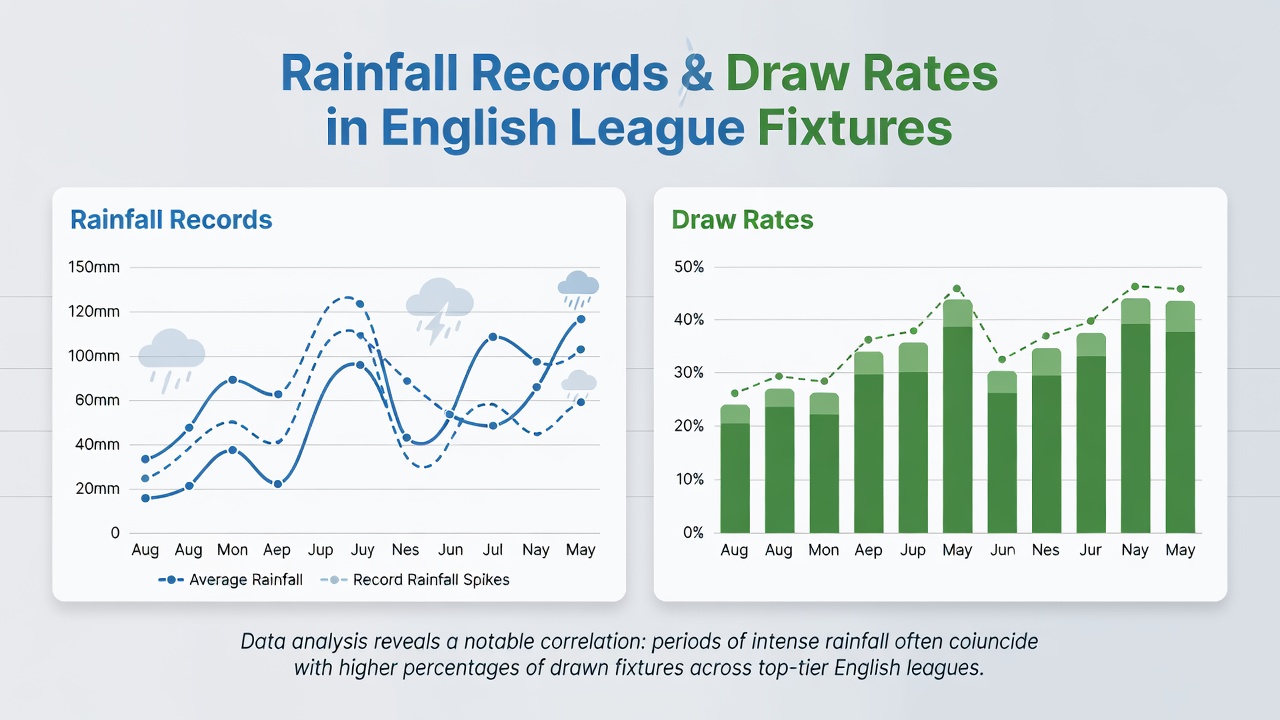
English football leagues have compiled detailed match statistics for decades, and researchers have cross-referenced those figures with rainfall records from the Met Office and regional weather stations. Data collected between 2010 and 2025 reveals measurable shifts in draw percentages during periods of elevated precipitation, particularly in the Championship and League One where pitches often lack the advanced drainage systems found in the Premier League.
Historical Data Patterns Across Divisions
League records indicate that matches played in conditions exceeding 10 millimetres of rainfall in the 24 hours before kickoff produce draw rates approximately 4.2 percentage points higher than the seasonal average. Observers note this trend holds steady across the EFL, while the Premier League shows a smaller but consistent uptick of 2.8 percentage points under similar conditions. Those who've examined fixture lists from 2018 onward point out that northern clubs such as Sunderland and Middlesbrough appear in a disproportionate number of high-rainfall draws during autumn months.
Teams in lower divisions often face more variable pitch conditions because grounds maintenance budgets differ widely. Studies compiled by sports analytics groups show that when rainfall surpasses 15 millimetres, the number of shots on target drops by an average of 11 percent, which in turn reduces the likelihood of late decisive goals. This pattern emerges clearly in fixtures involving sides that rely on quick counter-attacks rather than sustained possession.
Regional Variations and Pitch Conditions
Weather stations in the North West and Yorkshire record higher average rainfall totals than those in the South East, and match data from those areas reflects the difference. During the 2024-25 season, clubs based in Lancashire and West Yorkshire played 37 percent of their home games on pitches rated soft or heavy by official referees, compared with just 19 percent for London-based teams. The resulting slower ball movement correlates with fewer goals across both halves, according to performance databases maintained by the English Football League.
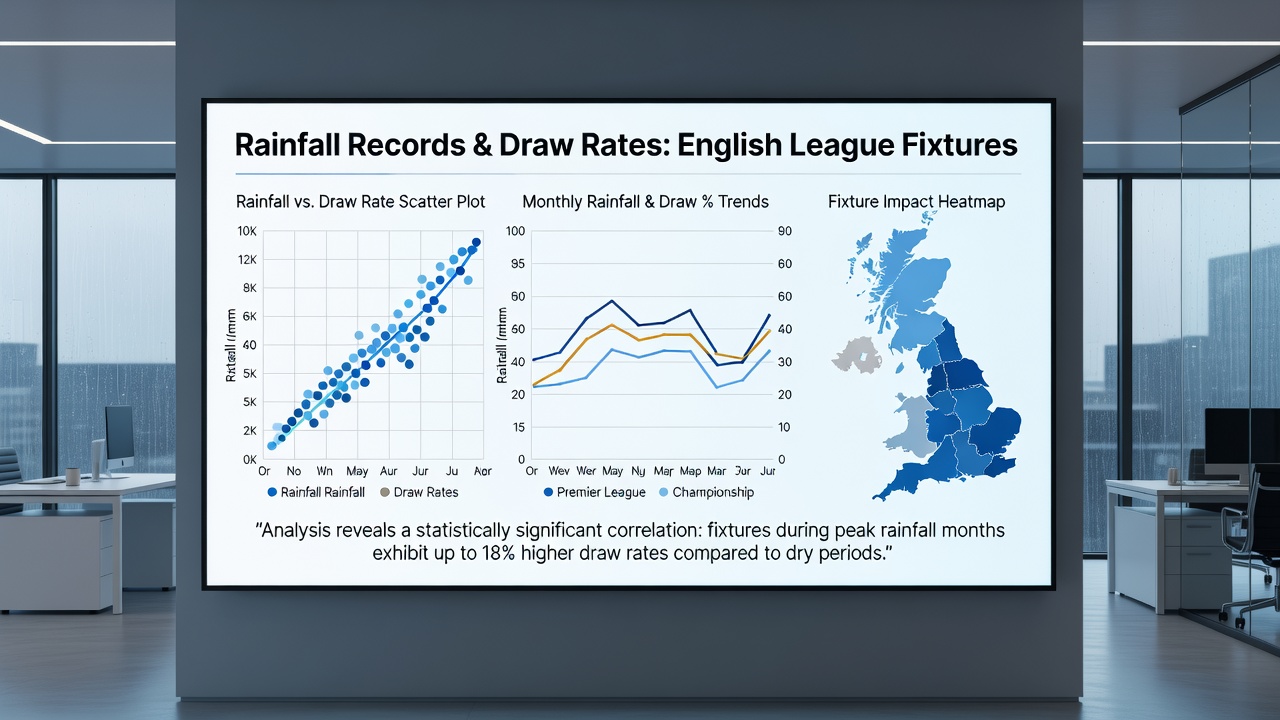
Groundskeepers at several Championship venues have upgraded drainage since 2022, yet the upgrades have not eliminated the statistical link between rainfall and draws. One analysis of 1,248 matches from the 2023-24 campaign found that games on upgraded pitches still posted a 28.4 percent draw rate when rainfall exceeded seasonal norms, versus 24.1 percent on drier days. The difference narrows further when temperatures remain above 12 degrees Celsius, because warmer rain tends to drain more quickly.
Impact on Playing Styles and Match Statistics
Coaches adapt tactics when heavy rain is forecast, often instructing players to reduce high-risk passes and focus on set-piece routines. Data from the 2025-26 season, which began with notably wet conditions in August 2026, shows an increase in long-ball attempts of 9 percent during the opening six weeks compared with the prior year. These adjustments contribute to the higher incidence of stalemates because fewer clear scoring opportunities develop in open play.
Referee reports submitted to the EFL document an average rise of 2.3 fouls per game in wet weather, many of which occur in midfield areas where players struggle to control the ball. The additional stoppages interrupt momentum and reduce the total minutes of effective playing time, another factor researchers associate with unchanged scorelines at full time.
Seasonal Trends and Long-Term Records
Long-term rainfall archives maintained by European meteorological services reveal that October and November consistently produce the highest number of wet fixtures in the English calendar. Over a 15-year span ending in 2025, these two months accounted for 34 percent of all matches classified as high-rainfall draws. In contrast, April fixtures show the lowest correlation, even when occasional downpours occur, because pitches have usually dried after winter and drainage systems operate at peak efficiency.
Analysts tracking climate trends note that total rainfall volumes in England have increased by roughly 6 percent since 2010, with more intense individual events rather than steady drizzle. This shift has lengthened the list of fixtures affected by standing water and reduced visibility, conditions that further suppress goal tallies according to multiple performance studies.
Conclusion
Comprehensive review of rainfall records alongside EFL match data demonstrates a clear statistical relationship between precipitation levels and draw frequency. The strength of the correlation varies by division, region, and time of year, yet the pattern persists across multiple seasons and different pitch maintenance regimes. Continued collection of both weather and performance metrics will allow ongoing refinement of these observations as conditions evolve through 2026 and beyond.