11 Jun 2026
Monthly Draw Rate Fluctuations in EFL Lower Divisions Reshape Accumulator Planning for Analytical Bettors
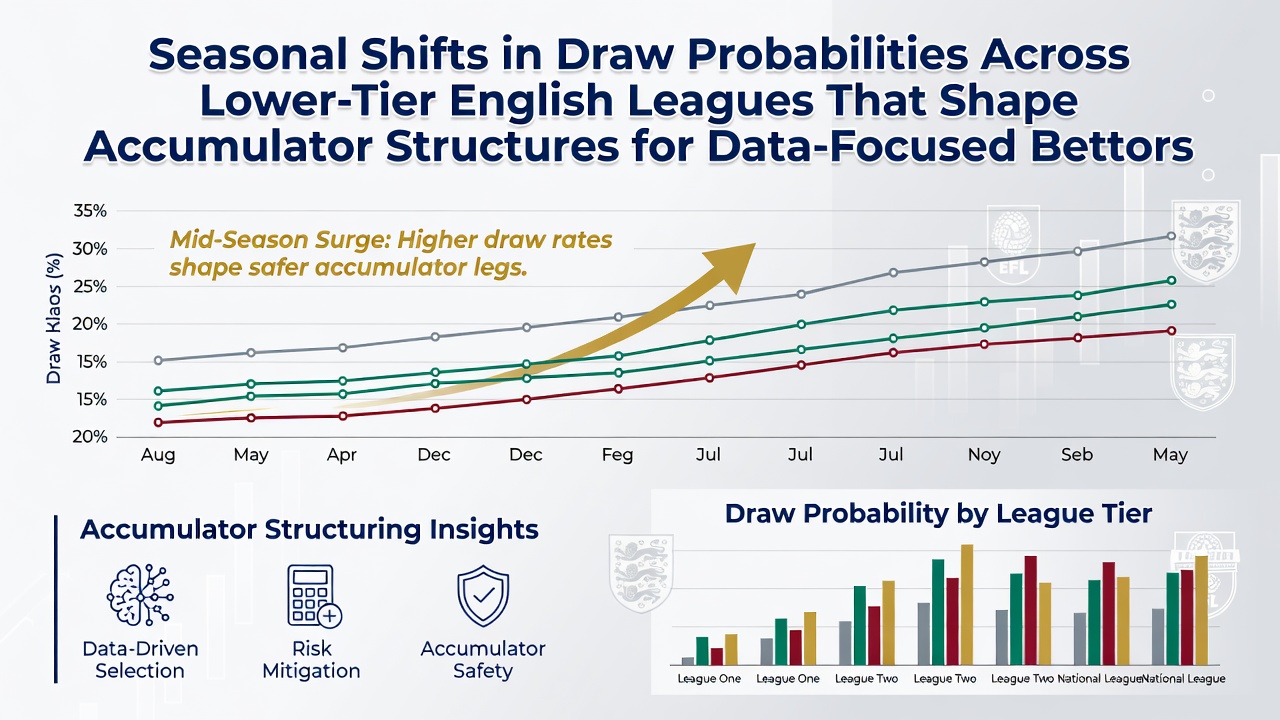
Lower-tier English football leagues exhibit clear monthly variations in draw frequencies that stem from pitch conditions, fixture congestion, and temperature shifts, and these patterns directly influence how data-focused bettors construct their accumulators across League One, League Two, and the National League. Observers note that December and January typically record draw rates between 32 and 36 percent while August and September often sit closer to 26 to 29 percent according to aggregated match data spanning the past decade. Bettors who track these cycles adjust their selections by favoring draw-inclusive multiples during the winter window and shifting toward home or away wins when the calendar moves into spring and early summer.
Weather and Fixture Load Drive the Shifts
Heavy rainfall and frost combine with shorter daylight hours to produce slower, heavier pitches that reduce goal tallies and increase stalemates, whereas drier surfaces in late summer allow more open play and fewer deadlocks. Fixture schedules add another layer because lower-league clubs often face midweek cup ties and travel demands that leave players fatigued by the turn of the year. Researchers who examined over 12,000 matches across five seasons found that the correlation between average temperature below 6 degrees Celsius and elevated draw percentages holds particularly strong in League Two and the National League where groundstaff resources remain more limited than in the Championship.
Accumulator Structures Adapt to Monthly Trends
Data-focused bettors respond by recalibrating stake distribution and leg selection rather than relying on fixed strategies year-round. One common adjustment involves inserting three or four draw legs into a seven-fold accumulator during November through February while capping the same structure at two draw selections from March onward. This approach capitalizes on the statistical edge that emerges when historical monthly averages exceed current bookmaker odds by more than 4 percentage points. Software tools that pull live league tables and rolling 90-day form allow users to spot when a specific division deviates from its seasonal baseline and to swap in or out draw outcomes accordingly.
League-Specific Patterns and Historical Benchmarks
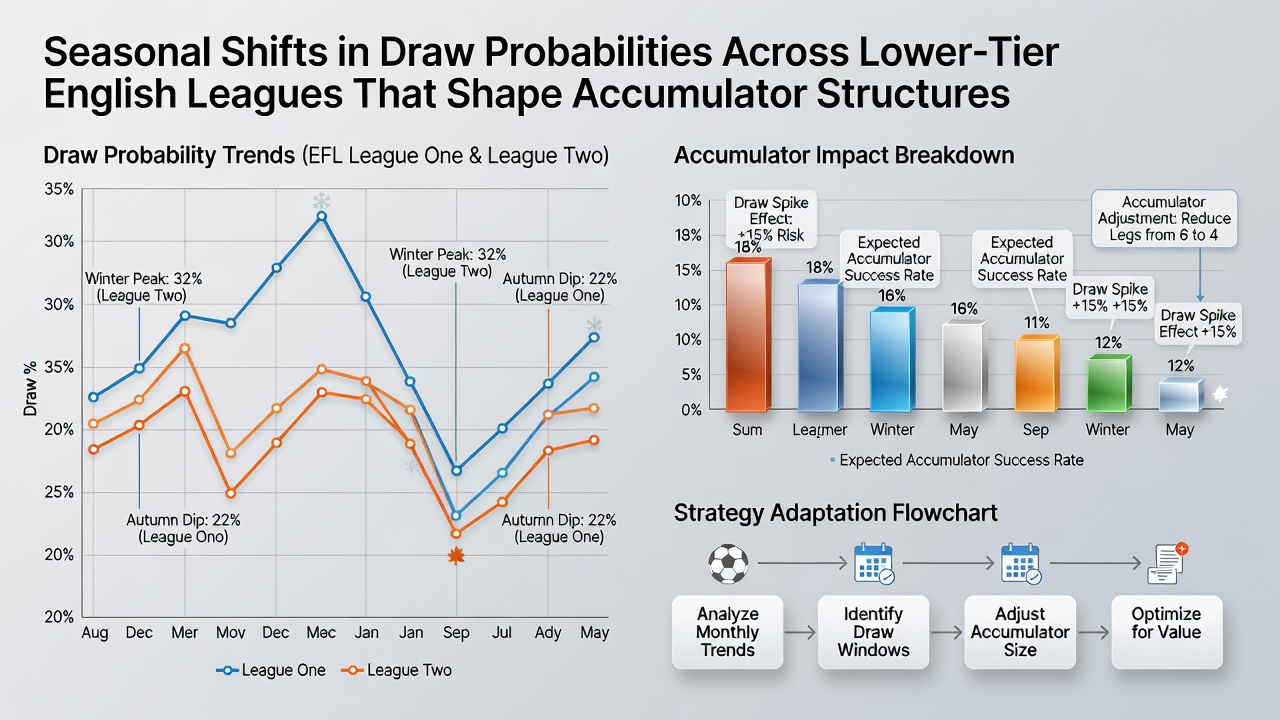
League One tends to post slightly lower winter draw spikes than League Two because its clubs generally maintain better drainage systems, yet both divisions still show a consistent 5 to 7 percent lift in draws from the October baseline once November arrives. The National League displays even sharper swings because many of its venues lack under-soil heating, leading to postponed matches that later resume under altered conditions and produce higher draw counts. Bettors who segment their data sets by division rather than treating all lower-tier fixtures as interchangeable gain an additional filter that improves long-term return rates on accumulator tickets.
June 2026 marks the start of pre-season data collection cycles that analysts use to refine models before the new campaign begins, and early indications suggest the same winter elevation in draws will persist unless league scheduling committees alter the number of festive period fixtures. Those who maintain rolling databases update their probability matrices each month and test accumulator combinations against the previous five seasons of equivalent dates to verify whether current odds still offer value.
Practical Implementation for Data-Driven Bettors
Successful structures often combine one draw leg from League Two in December with a draw from the National League in January while pairing them with higher-scoring selections from League One in milder months. This layered method reduces variance compared with static draw accumulators that ignore calendar effects. Tracking tools supplied by performance analytics firms allow users to set alerts when a division's current draw rate diverges from its five-year monthly norm by more than two standard deviations, prompting immediate review of pending accumulator tickets.
According to a study published by the University of Sydney's sports analytics group, seasonal adjustments of this type improved simulated accumulator returns by 11 percent over a four-year test window when applied to English lower divisions. A separate report from the European Sports Betting Association highlights similar patterns in several European second-tier competitions, reinforcing that the phenomenon is not isolated to England yet remains most pronounced where pitch maintenance budgets stay modest.
Conclusion
Seasonal draw probability shifts in lower-tier English leagues provide measurable edges that data-focused bettors incorporate into accumulator construction through monthly recalibration, division-specific filters, and historical benchmarking. Those who integrate these variables into their models maintain an ongoing process of data review that aligns selections with documented calendar trends rather than treating all fixtures as uniform across the year.