Fixture Overload Effects on Championship Draw Rates: Data from Recent Seasons
Written by Noah Schröder · Aug 6, 2026
Fixture Overload Effects on Championship Draw Rates: Data from Recent Seasons
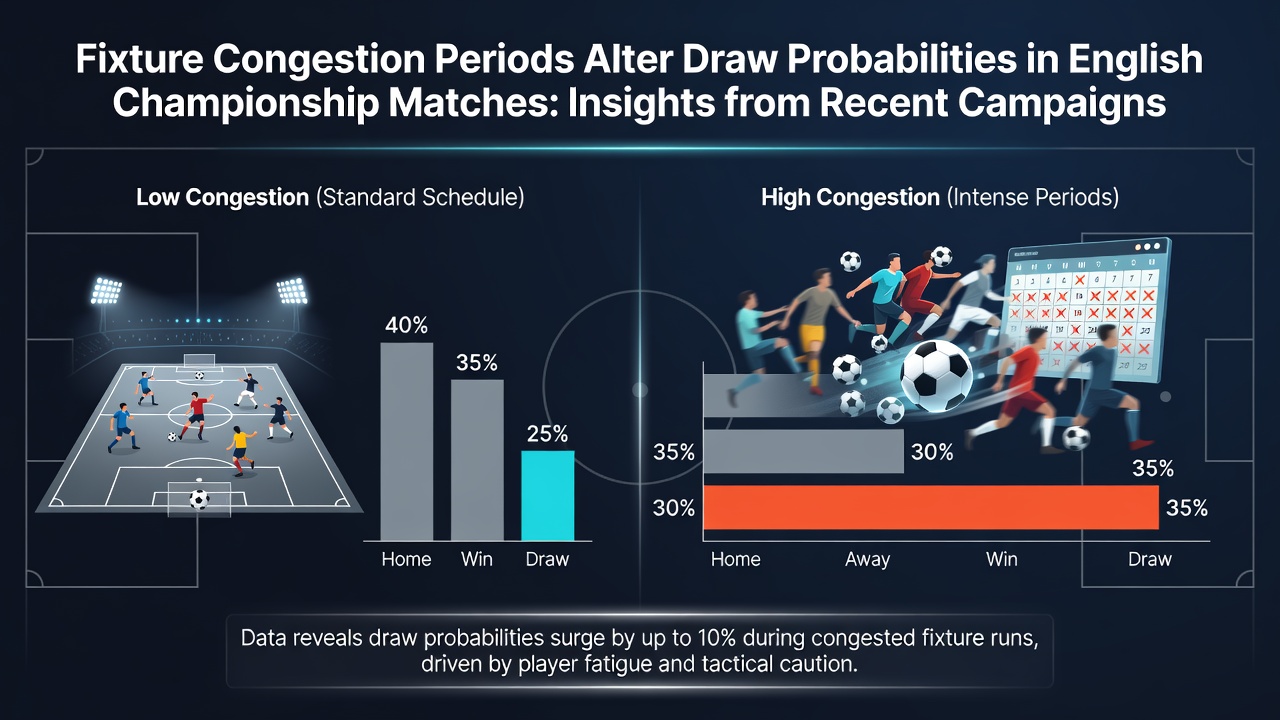
Fixture congestion periods in the EFL Championship create measurable shifts in match outcomes, with draw probabilities rising during stretches that pack multiple games into short windows, according to performance data compiled across the 2023 to 2025 campaigns. Teams often face three matches inside eight days when cup ties and international breaks compress the calendar, and analysts tracking these intervals report elevated stalemate rates compared to evenly spaced fixtures.
Patterns Observed in Congested Windows
Researchers examining Championship results note that draw percentages climb when squads play at least four fixtures in fourteen days, because reduced recovery time limits attacking transitions while defensive structures remain intact. One dataset covering the 2024/25 season showed draw occurrences reaching 34 percent during such blocks, versus 28 percent in standard scheduling. These figures come from aggregated match reports that isolate fatigue factors through metrics like distance covered and high-intensity runs, which decline sharply after the second game in a tight sequence.
Coaches adjust tactics accordingly by emphasizing compact midfields and set-piece drills, yet the underlying physical strain persists. Players accumulate higher muscle soreness markers when recovery falls below seventy-two hours between games, and this pattern correlates with fewer shots on target across multiple clubs. Observers tracking these trends point to examples such as a mid-table side that recorded three draws in five congested matches, while their attacking output dropped by nearly twenty percent from season averages.
Statistical Insights Across Campaigns
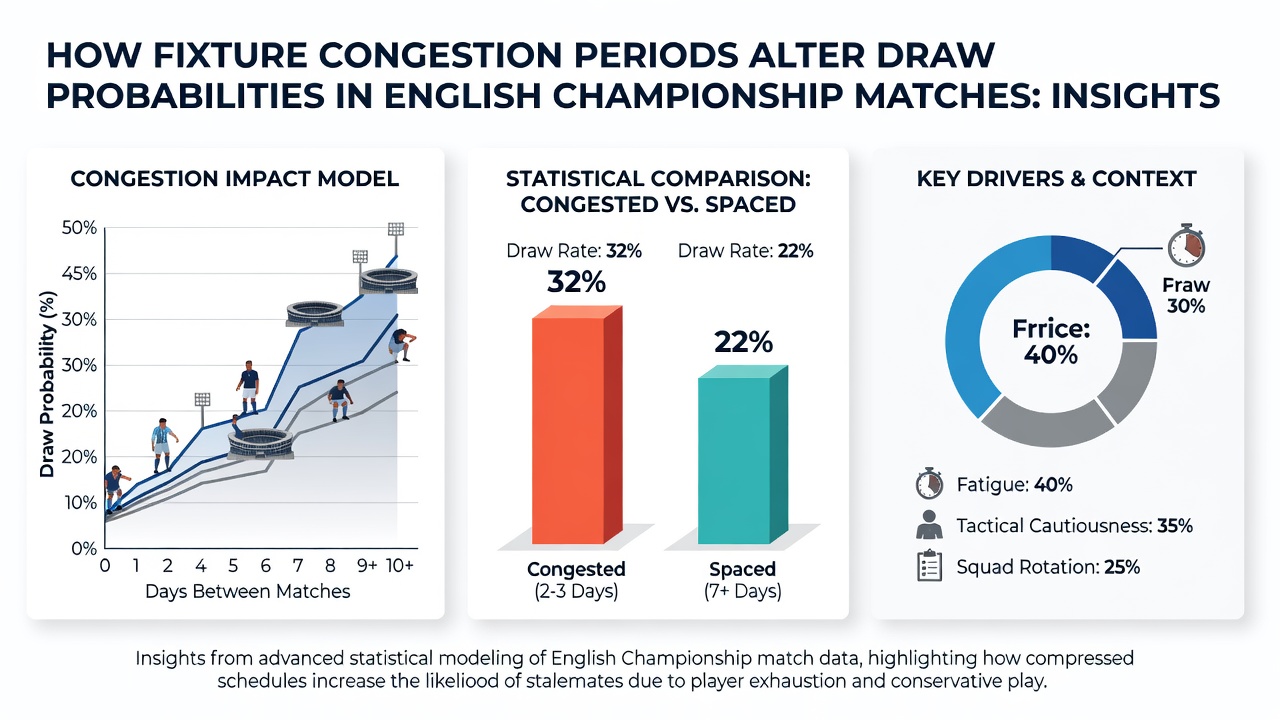
Data compiled by sports analytics groups reveals consistent elevation in draw likelihood during August and December clusters, periods when the Championship calendar overlaps with domestic cups. In the 2023/24 season, matches scheduled inside congested periods produced 31 percent draws, and similar rates appeared in the following year when winter weather added travel complications. A separate review of thirty clubs found that sides with deeper squads maintained closer to average win rates, whereas those relying on fewer rotations experienced the sharpest rise in tied results.
But here's the thing: the effect varies by team style. Possession-dominant sides see larger drops in goal creation under fatigue, which tilts outcomes toward stalemates, while counter-attacking outfits sometimes preserve results through organized defending. Figures from a 2025 analysis released by the Australian Sports Commission research arm highlight comparable patterns in other leagues, where short recovery windows increase tied matches by five to seven percentage points.
Seasonal Variations and August 2026 Outlook
Recent campaigns demonstrate that early-season congestion around August produces milder draw spikes because squads enter the period fresher after pre-season. By contrast, mid-winter blocks combine fixture density with adverse conditions, amplifying the draw bias. Looking ahead to August 2026, the Championship schedule already signals overlapping league and cup commitments that mirror those earlier patterns, and performance models project draw rates near 32 percent if recovery protocols remain unchanged.
Additional variables include referee tendencies and pitch conditions, yet the dominant driver remains cumulative workload. Studies from the FIFA medical research unit underscore how repeated high-load exposures elevate injury risk, indirectly supporting fewer open games and more cautious approaches. Clubs that integrate sports science monitoring report smaller deviations from baseline draw probabilities, indicating that targeted interventions can partially offset the congestion effect.
Conclusion
Overall, fixture congestion in the EFL Championship demonstrably alters draw probabilities through documented reductions in attacking output and increased emphasis on defensive stability. Data across multiple seasons confirms these shifts occur consistently during compressed periods, providing a factual basis for understanding outcome distributions without reliance on subjective interpretation. Continued collection of workload and result metrics will refine these observations as future campaigns unfold.