Deciphering Cricket's Seasonal Patterns and Their Ripple Effects on Spread Betting Markets
Written by Sofia Müller · Sep 13, 2026
Deciphering Cricket's Seasonal Patterns and Their Ripple Effects on Spread Betting Markets
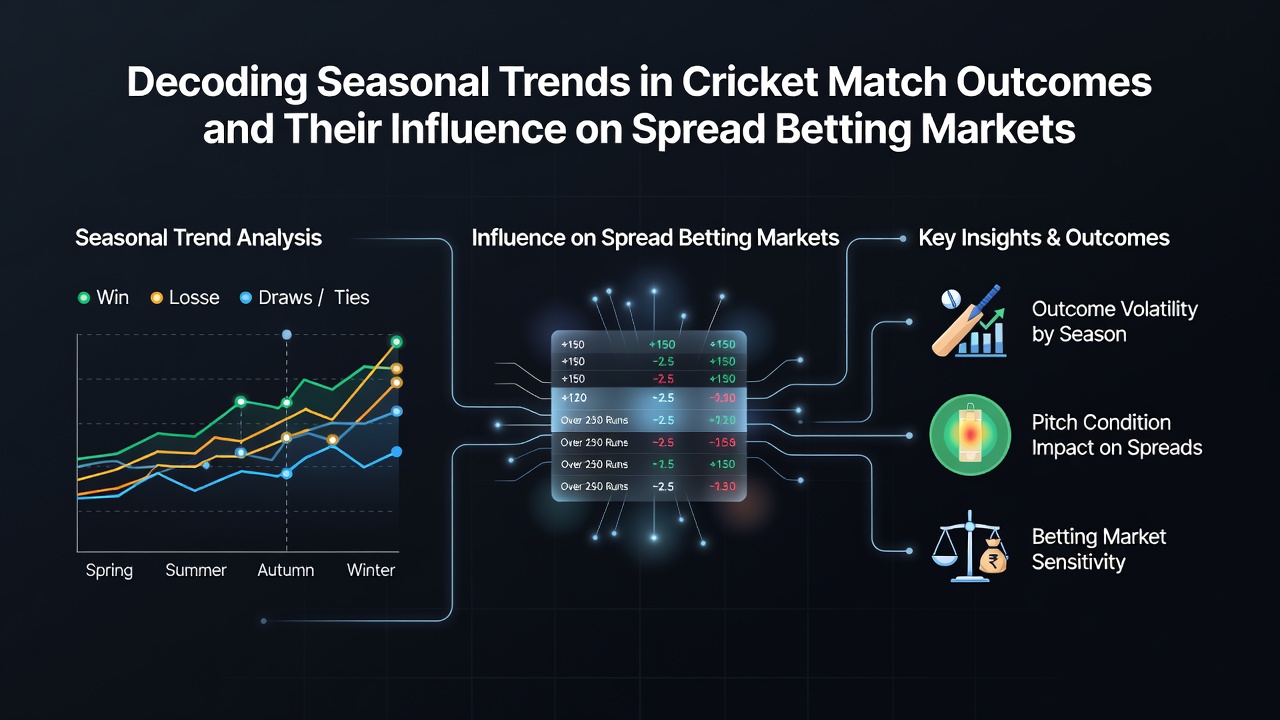
Cricket seasons unfold across hemispheres with distinct rhythms that shape match outcomes in measurable ways, and these patterns feed directly into spread betting markets where traders price runs, wickets, and session totals. Data from major competitions reveals that pitch behavior changes with temperature, rainfall, and daylight hours, while team performance metrics shift accordingly. Observers note that early-season fixtures in England often feature greener pitches that favor seam bowlers, whereas mid-summer contests see drier surfaces that assist spinners more frequently.
Understanding Seasonal Variables in Cricket Competitions
League schedules align with local weather windows, so the Indian Premier League operates during cooler months when dew forms heavily in evening games, altering ball grip and swing rates after the first innings. In contrast, the County Championship in England stretches from April through September, and records show that April matches produce higher draw percentages because of unpredictable showers that shorten play. September fixtures, including those scheduled around 2026 domestic calendars, tend toward lower totals as pitches wear and cracks widen, creating conditions where fourth-innings chases become rarer.
Researchers tracking ball-by-ball data across multiple years have documented how humidity levels correlate with swing movement, particularly in coastal venues during monsoon transitions. These environmental factors do not dictate results outright, yet they influence the distribution of scores that spread markets use to set lines on total runs or player performances. Bettors who monitor historical averages for specific months adjust their positions when forecasts indicate deviations from typical patterns.
Data Patterns Across Major Tournaments
International series add another layer because touring teams encounter unfamiliar seasonal conditions. Statistics compiled from Test matches between 2018 and 2025 indicate that visiting sides win fewer games in the first month of a tour when jet lag combines with unfamiliar pitch preparation methods. Home teams post stronger first-innings scores during their peak domestic season months, and this edge narrows as the series progresses into opposing seasonal windows.
One study released by the Australian Sports Commission examined limited-overs games played across different quarters of the calendar year and found elevated scoring rates during autumn months in southern venues, where grass growth slows and boundaries become more accessible. Such findings help explain why spread markets widen run lines during those periods while tightening wicket margins. Traders incorporate these seasonal baselines when they update quotes ahead of each round of fixtures.
Spread Betting Market Responses to Calendar Shifts
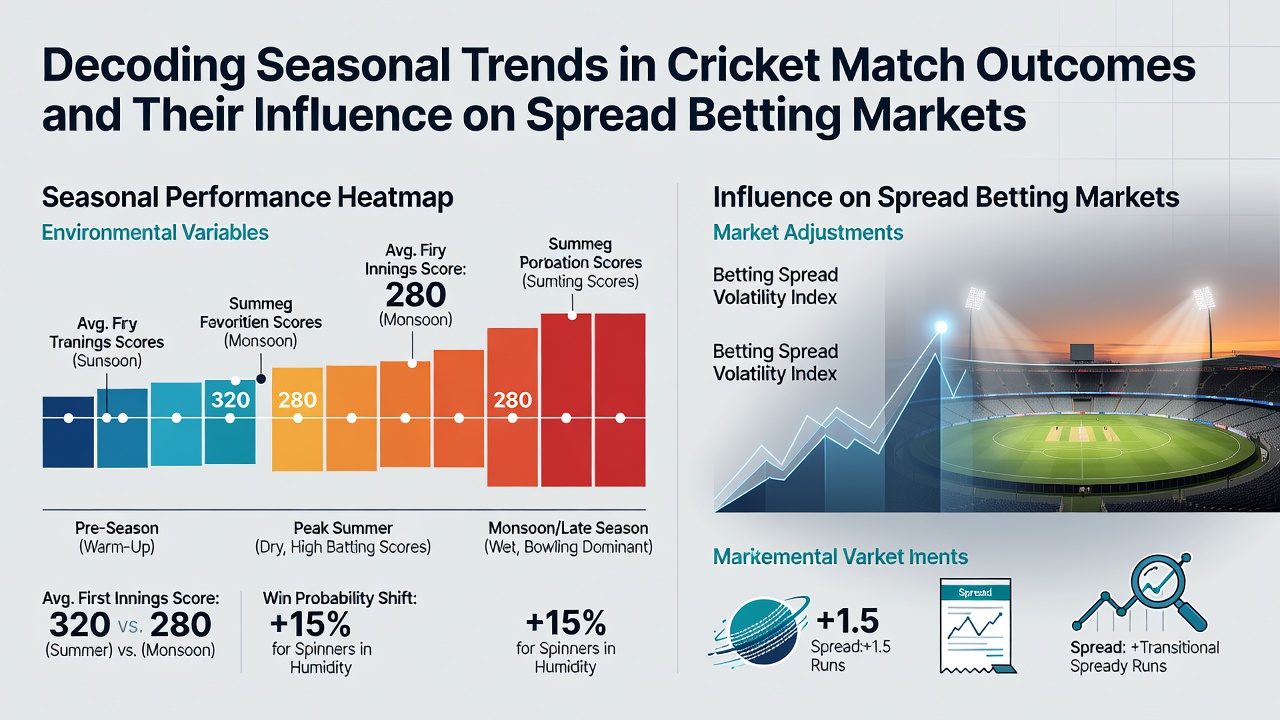
Spread betting platforms adjust their offerings in real time as seasonal trends emerge from ongoing matches. When early-season data shows elevated wicket tallies in the first ten overs, firms widen the spread on opening partnerships and shorten lines on top-order run aggregates. Market makers draw from rolling averages that weight recent months more heavily, allowing them to reflect current conditions without overreacting to single outliers.
September 2026 schedules include several high-profile limited-overs events that coincide with the tail end of northern summer conditions, and analysts expect these fixtures to feature slower outfields after prolonged dry spells. Spread traders have already begun quoting tighter margins on boundary counts for those contests, anticipating that fielders will cover ground more effectively on harder surfaces. Historical data supports these adjustments because similar late-summer periods produced measurable drops in sixes and fours per match.
Those who follow the markets observe that volatility increases during transitional months when weather patterns shift rapidly. A single unseasonal downpour can compress an entire innings into fewer overs, pushing session run spreads lower and forcing rapid repricing. Automated models used by professional traders ingest meteorological forecasts alongside player statistics to generate updated lines, yet human oversight remains essential when unexpected pitch reports emerge from grounds staff.
Regional Differences and Long-Term Trends
Cricket boards in different regions publish pitch and weather reports that feed into seasonal databases, and these documents reveal consistent regional signatures. Venues in South Asia experience pronounced dew effects during winter evenings, while southern African grounds show greater day-night temperature swings that affect seam movement. Spread operators incorporate these location-specific seasonal profiles when they set initial lines for touring series.
Longer-term climate records indicate gradual changes in average rainfall and temperature that may alter future baselines, though current market pricing still relies primarily on the past decade of match data. Industry reports from bodies such as the Australian Institute of Criminology highlight how betting volumes on cricket rise during peak domestic seasons, with spread products capturing a growing share because they allow positions on micro-events rather than binary outcomes.
Conclusion
Seasonal trends in cricket produce measurable shifts in scoring distributions, team performance, and pitch behavior that directly inform how spread betting markets establish and revise their lines. Data from domestic leagues and international tours demonstrates that calendar position, combined with venue-specific weather cycles, influences the probability ranges traders use to quote runs, wickets, and session totals. Market participants who integrate these patterns into their analysis gain access to pricing that reflects accumulated historical evidence rather than isolated match narratives. As schedules evolve and environmental records lengthen, the relationship between seasonal variables and spread dynamics continues to develop in observable ways.